[Video Transcript]
‘Rotating Region’ is a powerful feature that’s used to simulate fluid driving motion in rotating components. Now, in SOLIDWORKS Flow Simulation 2021, Rotating Regions can be combined with the ‘Free Surface’ feature. This is ideal for mixing tasks and can be leveraged further to gain more insight into product performance.
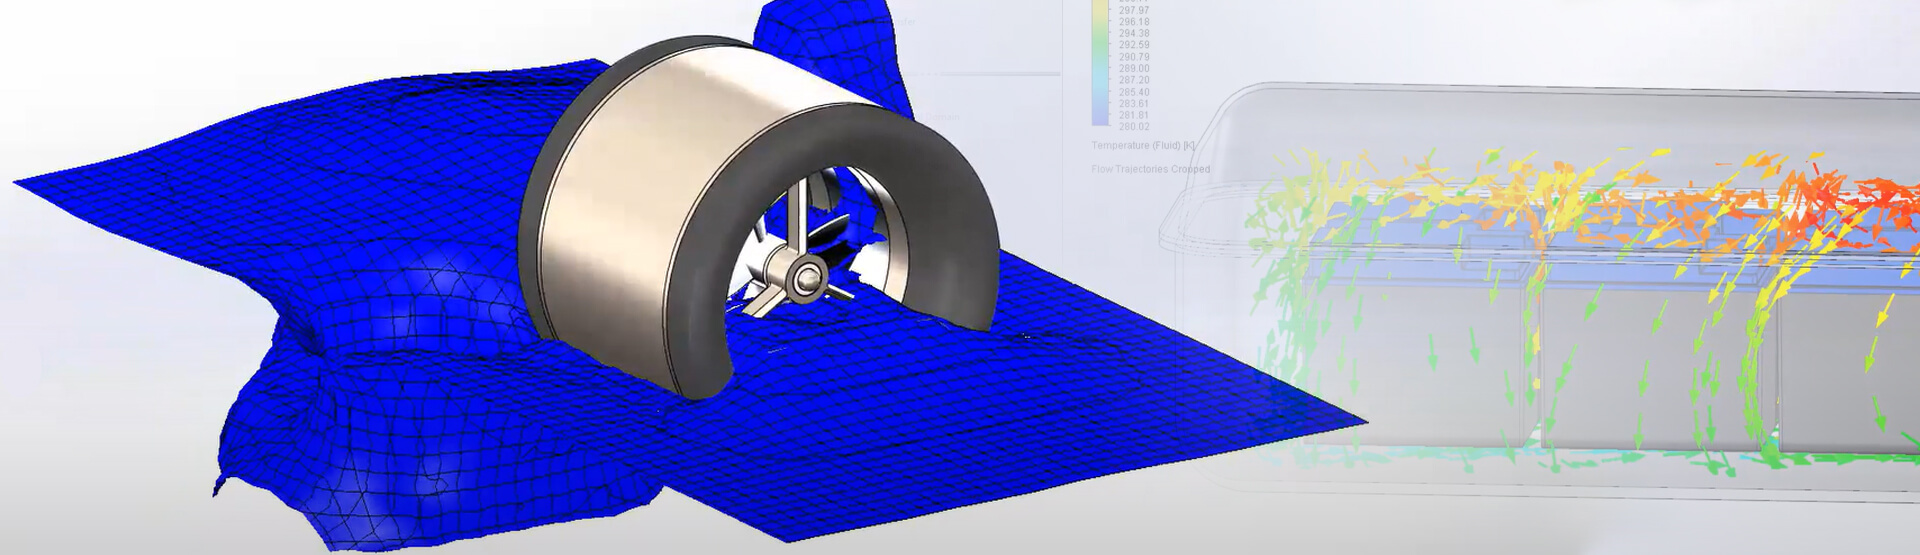
For this thruster, we’re solving the torque and power requirements when it interacts with two separate fluids simultaneously. Goals are created to track these outputs, and by going to the history section of the goal plot, their values can be viewed throughout the duration of the study. With SOLIDWORKS Flow Simulation 2021, new columns provided in the summary table make it easier than ever to find the maximum value, and when it occurs.
Creating common plots to visualise results is now even more efficient by using the new ‘Create-Plots-From-Scene’ command. You can even create the same plots in multiple projects all at once, just activate the plots to view them. In SOLIDWORKS Flow Simulation 2021, if you create one or more plots you want to use in other projects, simply show the desired plots and choose the new ‘Create Scene Template’ option. Now you’re ready to create your various custom plots in any other project with only one command.
Another common application for SOLIDWORKS Flow Simulation is heat transfer. This vehicle enclosure has multiple electrical components inside that generate heat. The enclosure itself is designed to act as a heat sink, but how can you determine exactly how the heat is moving from one place to another? The ‘Flux Plot’ provides a graphical interface where you can easily understand where heat is coming from, and where it’s going. A new option in this plot groups all items by type so you can quickly check the energy balance of the simulation and ensure that your study has fully converged.
In SOLIDWORKS Flow Simulation 2021, investigating specific areas of the model can be done by creating a cropped region. When you click the automatic plot min and max options, they are now calculated from this cropped region so you can clearly communicate the range of values without further manual modifications. Another improvement with Goals is the ability to calculate the minimum, average, and maximum from a selection of goals. For example, you can easily discover the maximum temperature across all of the batteries and PCBs with minimal setup work.
To further reduce your amount of manual calculations in Flow Simulation 2021, ‘Custom Visualization Parameters’ can now depend on other ‘Custom Visualization Parameters’. The Magnus formula for calculating Dew Point Temperature is a great example of when to use this new functionality. Just set up the items in the Engineering Database once and they’re ready to use for your past, current and future projects.
To find out more about SOLIDWORKS Flow Simulation 2021,
call us on 01223 200690 or send us a message below.
We hope you found that useful!
Have you seen our blog archive where we have posted plenty of helpful articles? We also have a fantastic video library filled with easy-to-follow videos on a number of topics inspired by other SOLIDWORKS users – take a look. Also, don’t forget to follow Innova Systems on Twitter for bite-size SOLIDWORKS tips, tricks, and videos.