The performance evaluation tool is available to use in parts, drawings and assemblies and is great to use if you’re suffering poor assembly performance – particularly in terms of rebuild times.
Prior to SOLIDWORKS 2016 the tool was called ‘Assembly Xpert’, however the name of the tool was changed to ‘Performance Evaluation’ to unify the name across all 3 environments (parts, assemblies & drawings).
Where is the Performance Evaluation tool?
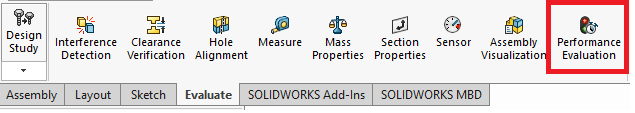
‘Performance Evaluation’ can be found on the ‘Evaluate’ toolbar as shown below:
What does Performance Evaluation do?
As the name suggests, Performance Evaluation analyses performance of assemblies and suggests possible actions you can take to improve performance. This is useful when working with large complex assemblies. In some cases, you can select to have the software make changes for you.
Performance Evaluation runs a series of diagnostic tests and presents the results to you in a dialogue box as per the image below:
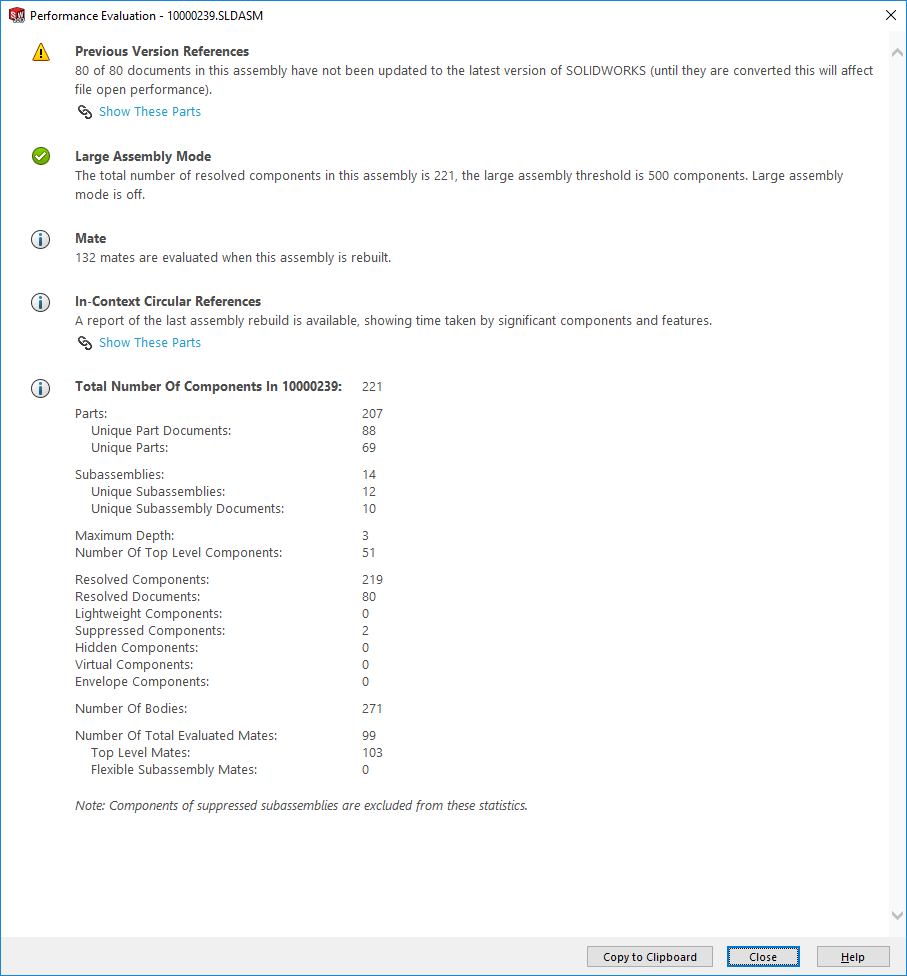
Below are some (not all) of the key tests performance evaluation runs:
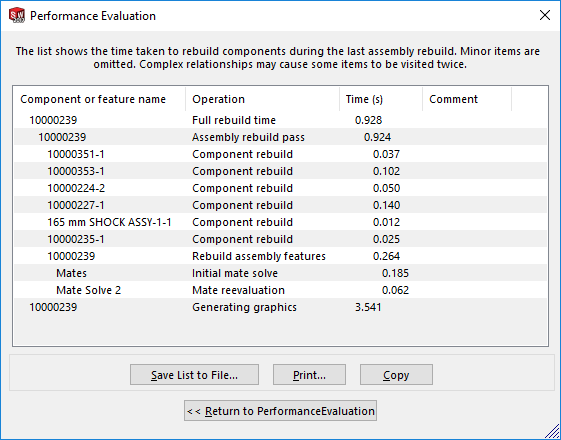
Rebuild report – If the assembly takes more than 10ms to rebuild, Performance Evaluation provides a report of the rebuild time for the total assembly. The report shows the time taken to rebuild significant components and features.
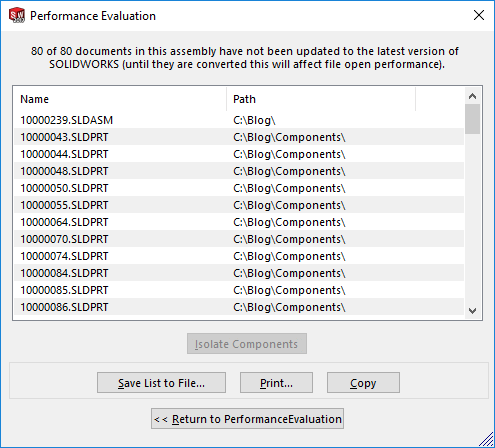
Previous Version References – It takes SOLIDWORKS longer to open up previous version files. Performance Evaluation reports whether or not all files have been updated to the current version of SOLIDWORKS. If files haven’t been updated to the latest version, we would recommend updating them as you will see an improvement in performance.
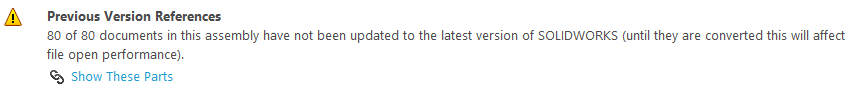
In the above image all the documents in the assembly are from an older SOLIDWORKS version, as you can see there is also a link to ‘Show These Parts’, which will present a dialogue displaying all the older version files within the assembly as per the below image:
Mates – Performance Evaluation will report the number of mates that are solved when the assembly rebuilds:
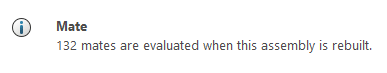
Depending on performance it will also report back any components that are mated to assembly features (such as assembly level cuts) or any patterned components. This is because it takes longer to evaluate in those circumstances as SOLIDWORKS needs to rebuild the assembly features & patterns before it can recalculate the mates.
In-Context Part Performance – If you design parts in the context of an assembly, you may find an increase in rebuild times. This is because as the assembly rebuilds, the parts that have features defined ‘in-context’ of the assembly may also rebuild. So rather than just rebuilding the assembly tree, you’re also rebuilding some of the parts. If the part that is defined ‘in-context’ has a very complex feature tree, that part in itself could take a long time to rebuild and therefore contribute to an unnecessarily long assembly rebuild time.
Within the performance evaluation dialogue, it will report any components where rebuilding in context components contribute a significant percentage of assembly rebuild time as per the below image:
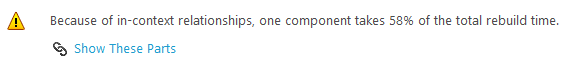
You can click on the ‘Show These Parts’ link to give you a breakdown of the parts and the percentage of rebuild taken.
It’s generally recommended that external references be removed, locked or broken if rebuild times are becoming an issue for you.
In Context Circular Reference – Let’s say we have an assembly with 2 components defined in context (‘Part A’ & ‘Part B’), where the geometry of ‘Part A’ references the geometry of ‘Part B’, but the geometry of ‘Part B’ references the geometry of ‘Part A’. This can be a cause for a circular reference.
This is because as the assembly rebuilds, ‘Part A’ would rebuild during that process, then ‘Part B’ would rebuild. Because ‘Part B’ has rebuilt ‘Part A’ now has to rebuild as it is reliant on the geometry of ‘Part B’, then because ‘Part A’ has rebuilt ‘Part B has to rebuild again, and we continue through that loop. If you’ve ever rebuilt an assembly and the rebuild symbol will not go away, it is likely you have a circular reference.
Performance evaluation reports back on any circular references within the design as follows:

We’re given the option to show these parts which brings up another dialogue box that displays the affected components, as well as rebuild time information.
Components Far From Origin – We occasionally field support calls where a customer will report that they can no longer see an assembly when they go to a standard view or click on ‘Zoom To Fit’. One of the reasons this can happen is that they have accidentally placed a component really (and we mean really) far away from the origin and the rest of the assembly.
Naturally when you go to a standard view it will try and show you the entire assembly, and if you have a component very far from the origin it will zoom out a huge amount. Therefore, your assembly will appear tiny on your screen (often way too small to see).
It used to be the case that we would need to go through the assembly tree and use the zoom to selection tool to find the distant component – Incredibly long-winded and tedious.
Performance Evaluation now reports back any components that are far away from the origin as per the image below:

Not only does it tell you about these parts, if you click the ‘Show These Parts’ link it will move the far away component closer to the origin and the rest of the assembly (but still far enough away so it is distinctly separate).
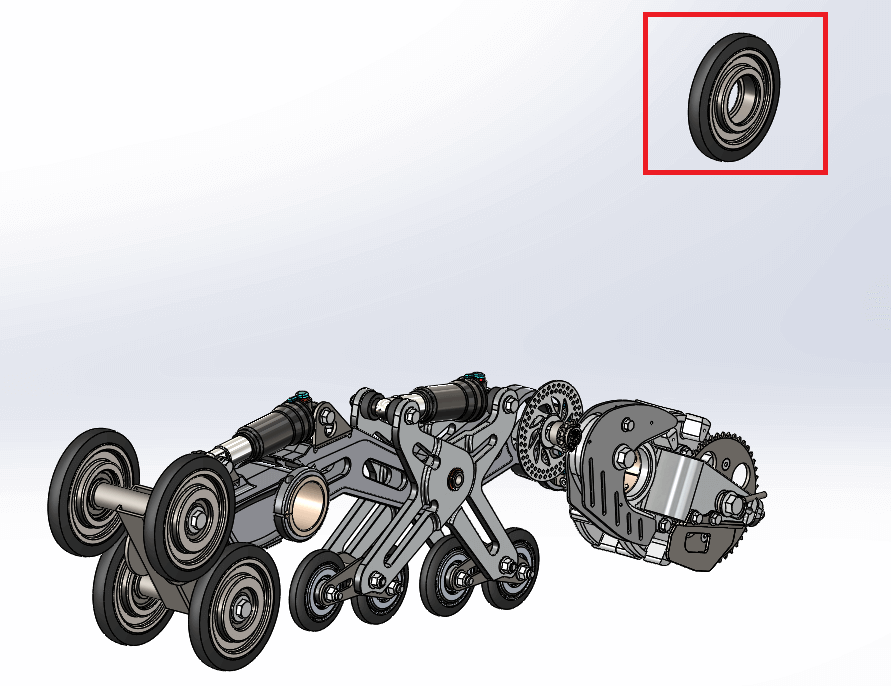
For example, in the below image we manually moved the wheel component far away from the origin such that when we zoomed to fit, the graphics area appeared to be empty. On clicking the ‘Show These Parts’ button it moves the highlighted wheel closer to the assembly.
Hopefully you can see the Performance Evaluation tool is very useful and should be one of the first features you look to when you are suffering with poor assembly performance.
We hope you found that useful!
Have you seen our blog archive where we have posted plenty of helpful articles? We also have a fantastic video library filled with easy-to-follow videos on a number of topics inspired by other SOLIDWORKS users – take a look. Also, don’t forget to follow Innova Systems on twitter for daily bite size SOLIDWORKS tips, tricks and videos.